Dashboard tour
The optional dashboard — overview and pulse health, entries per type, traces, the Horizon-style live queue console with default-deny mutations, and schedules.
@dudousxd/nestjs-telescope-ui is a bundled React SPA served by a NestJS module. No frontend dependency is imposed on your app: React and Tailwind are bundled into static assets at publish time; your app just serves them. It works on Express and Fastify.
Mount it
import { Module } from '@nestjs/common';
import { TelescopeModule } from '@dudousxd/nestjs-telescope';
import { TelescopeUiModule } from '@dudousxd/nestjs-telescope-ui';

@Module({
  imports: [TelescopeModule.forRoot(), TelescopeUiModule.forRoot()],
})
export class AppModule {}
Open /telescope. The dashboard polls /telescope/api/* and renders the views below. It ships a dark theme by default, with a theme toggle in the shell, a window selector (1h / 24h / …) for the aggregate views, and a live / pause toggle for polling.
Overview & Pulse
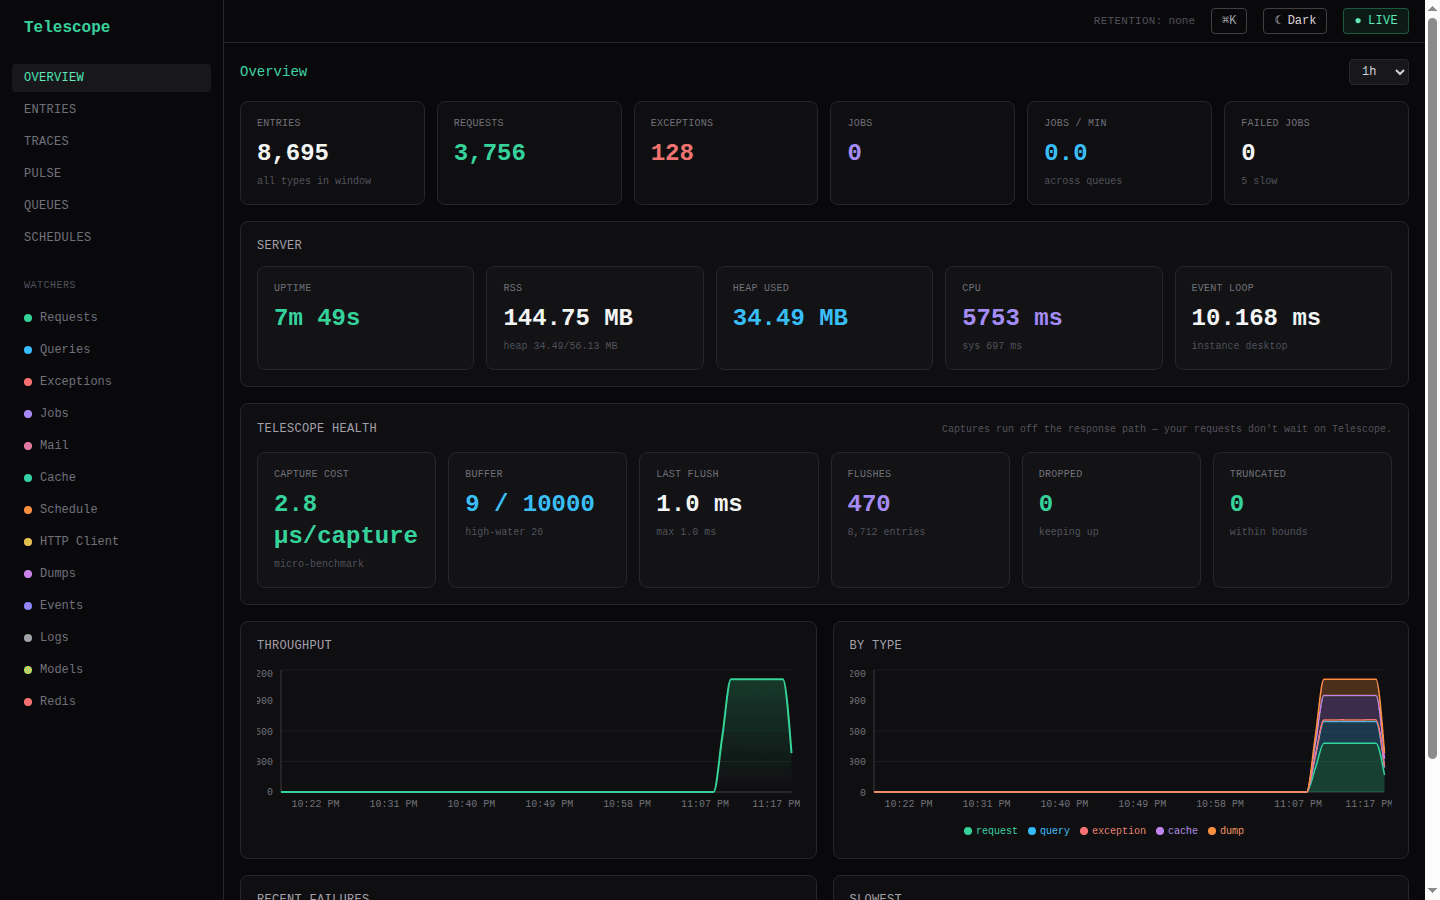
The Overview is organized by criticality — "what's wrong right now" above the fold, trends and self-health below.
- Top — operational triage. A focused stat row (Requests with the total-entries figure as a hint, Error rate = exceptions ÷ requests over the window — red above 5%, Failed jobs, and Slow routes = the count of route families whose p99 is over the slow threshold — see Pulse below), followed by Recent failures, an N+1 query hotspots card (the same detection the Pulse view surfaces, mounted here so it's reachable from the landing page), the Slowest entries, and a Queues needing attention card that lists only queues with failed jobs or a large pending backlog (links to the queue console; shows "All queues healthy" when clean). Every figure is derived from data already served by
/pulseand/queues— no extra endpoints. - Bottom — trends & self-health. A throughput-over-time area chart from
/timeseries, a per-type stacked area, then the Server vitals and the Telescope health card — host-path µs per capture, buffer pressure, flush p95, and dropped count, straight from/health(see Performance).
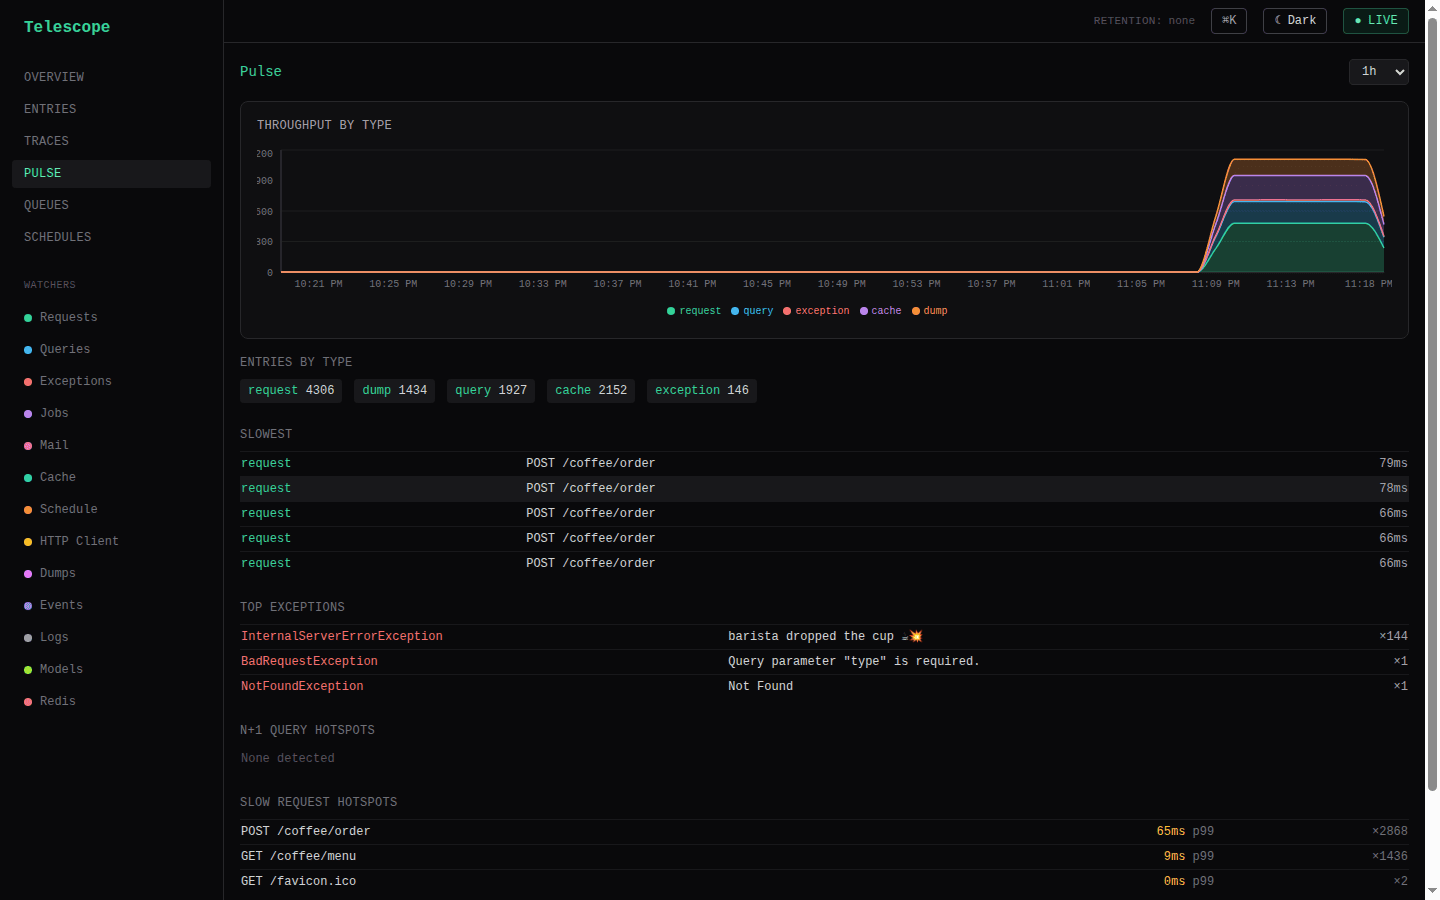
Pulse (#/pulse) is the at-a-glance health snapshot from /pulse: per-type entry counts, the slowest entries, the most frequent exceptions, N+1 query occurrences, and slow-request hotspots — all rolled up from captured entries.
Slow request hotspots (and the matching slow-outgoing-HTTP card) are route families ranked by p99, but only those whose p99 is at or over a slowness threshold — so a quiet host shows "No routes over the slow threshold" instead of flagging a healthy /health at 18ms as a hotspot. The threshold defaults to 1000ms (matching the slow tag), and is configurable via pulse.slowRouteMs in TelescopeModule.forRoot(...):
TelescopeModule.forRoot({
  // Only routes whose p99 ≥ 250ms count as slow hotspots (default 1000).
  pulse: { slowRouteMs: 250 },
});
The Slowest entries list is a deliberate top-N ranking with no threshold — it answers "what were the slowest things in the window" regardless of how fast that is.
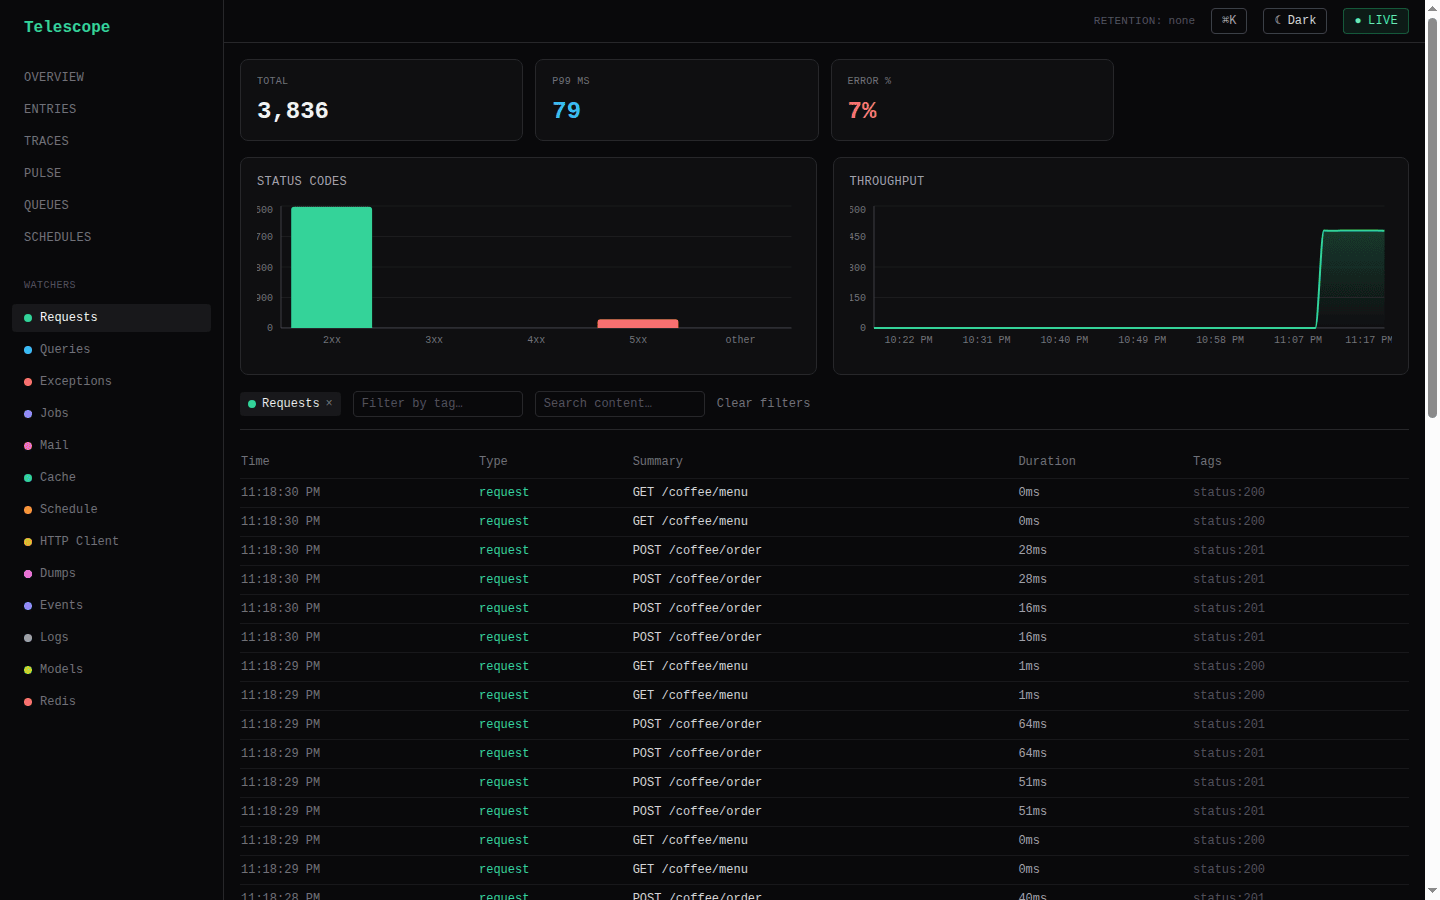
Entries, per type
The entries view is the heart of the console: type tabs (request / query / job / exception / mail / cache / event / log / model / redis / client errors / …) with live polling. The per-type nav is watcher-driven — the sidebar and tabs render only the types whose watcher is actually registered (from meta.watchers), so you never see a dead "Redis" tab on an app that has no Redis watcher. request and exception always show (they're captured unconditionally), and direct URLs to a hidden type's page still work. While meta is loading, every type shows — there's no flash of hidden nav. The Client errors tab (client_exception) follows the same rule — it appears only when you've opted into the public frontend error endpoint (clientErrors.enabled); each entry renders the browser error's message, stack, component stack, URL and user-agent. The top-level Traces link follows the same rule: it appears only when the host wired a traceContext provider (meta.tracesEnabled), since without one every entry's trace_id is null and the page would be permanently empty.
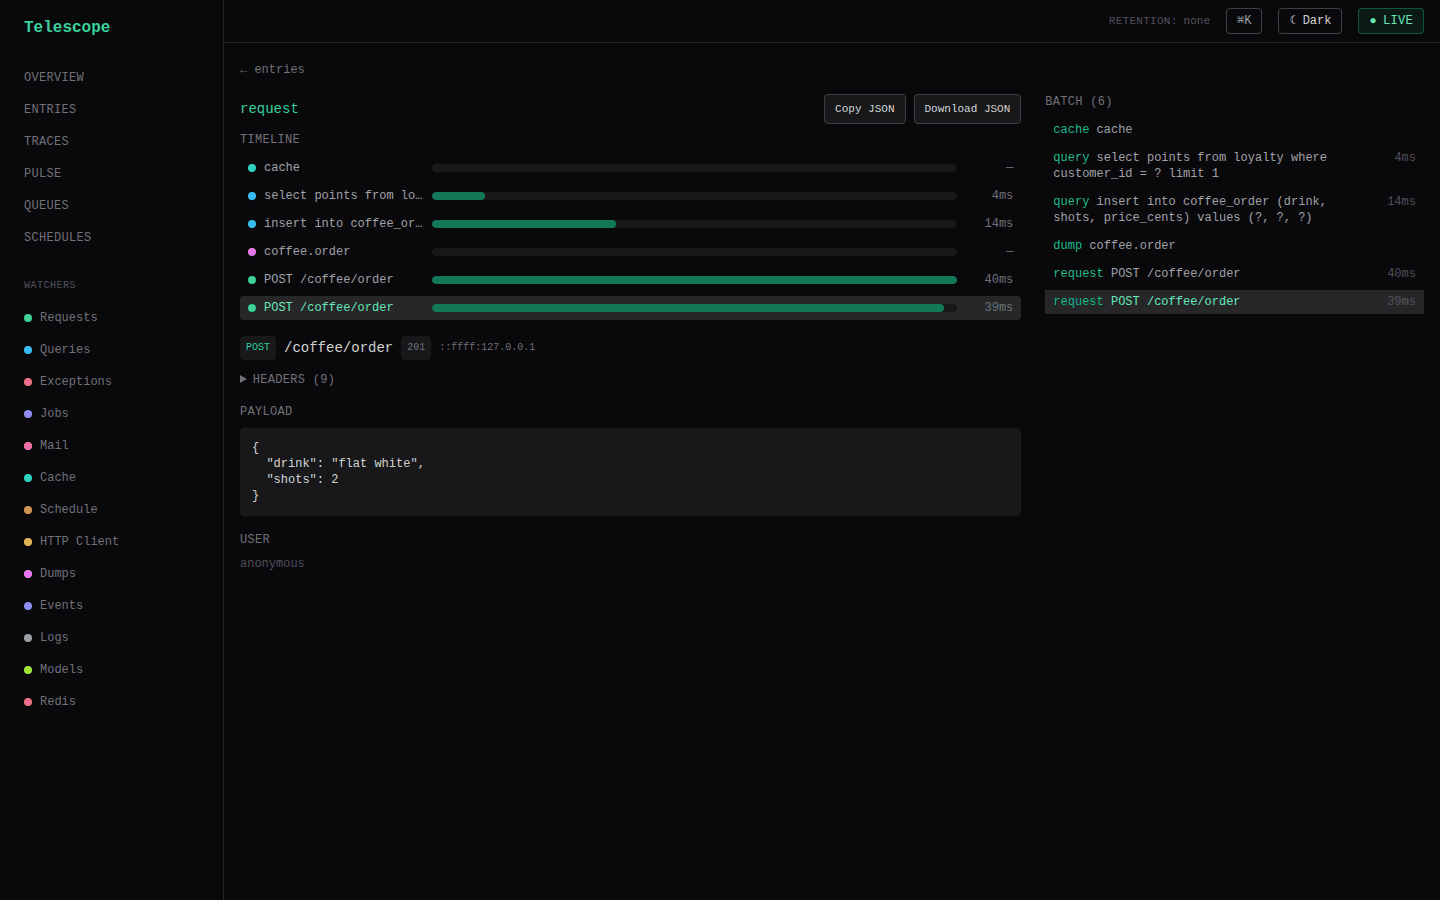
Open any entry to see its correlated batch — the request and everything it caused, in capture order. Each entry shows its type-specific content (the SQL of a query, the recipients of a mail, the stack of an exception), its tags, and its duration. Per-type insights surface query-latency percentiles per shape, cache hit/miss/ratio badges, and exception groupings.
The filter bar carries a generic tag combobox and a dedicated User combobox. The User filter queries the user: tag namespace (the ids the built-in userTagger emits) and displays bare ids with their entry counts; selecting one applies the underlying tag=user:<id> filter but renders as a User: <id> chip. The "View all activity for this user" pivot links in the entries table feed the same control — a user:<id> tag arriving via ?tag= is recognized and shown as a User chip, not a raw tag.
Explain slow queries
Telescope is database-agnostic, so EXPLAIN is opt-in via a host hook — you bring the connection and dialect. Supply explainQuery to TelescopeModule.forRoot, and the query entry detail grows an Explain button that replays the captured SQL through your hook and renders the engine plan inline.
TelescopeModule.forRoot({
  // The hook runs arbitrary `EXPLAIN <sql>` against your DB — scope this
  // connection READ-ONLY (and to non-sensitive schemas).
  explainQuery: async (sql, bindings) => {
    const [rows] = await pool.query(`EXPLAIN FORMAT=JSON ${sql}`, bindings);
    return rows;
  },
});
POST /telescope/api/queries/explain ({ entryId }) loads the query entry, runs the hook on the SQL/bindings exactly as captured, and returns { plan }. When the hook isn't configured the button is hidden (meta.explainEnabled is false); a hook that throws surfaces as a clean error message in the panel rather than a crash.
Diagnose exceptions with AI
Configure the @dudousxd/nestjs-telescope-ai package's ai.diagnoser and every exception (and browser client_exception) detail page grows a Diagnose with AI button. Clicking it POSTs POST /telescope/api/exceptions/:id/diagnose and renders a markdown report — probable cause, where to look, a suggested fix, and a confidence rating — built from the redacted exception, its route, and the request's recent SQL. Results are cached per error family (24h); a cached result shows a cached badge with a Re-run action. The button is hidden when AI isn't configured (meta.ai.enabled is false). See the AI exception diagnosis recipe.
Replay a request
A request entry detail offers a Replay action that re-issues the captured request against your own running server, so you can reproduce "what exactly did this 500 do?" from the dashboard without hand-crafting the call. It hits GET /telescope/api/entries/:id/replay, which re-issues the captured method/path/body against 127.0.0.1 (the local server, resolved from the request's port) and reports the replayed status, duration, and a truncated response body.
Replaying actually hits your app — which may write — so it is a mutation gated by authorizeAction, the same default-deny gate the queue console and Prune now use. Without an authorizeAction callback the endpoint returns 403 even for callers the read authorizer already trusts, and the Replay action is hidden.
The replayed request carries an x-telescope-replay: 1 header (so your app can recognize or skip it) and strips the cookie, authorization, and host headers — a replay must never silently reuse the original caller's session or credentials. Its own captured request entry is tagged replay, so replays are distinguishable from real traffic in the entries table (and via the MCP list_entries tool).
Retention controls
The Overview page surfaces a Retention card with the configured window (from prune) and a Prune now button. Pruning is a mutation, so the button appears only when retention is configured and mutations are enabled (authorizeAction present — the same default-deny gate the queue console uses). It fires POST /telescope/api/retention/prune after a confirm and reports how many entries were removed.
Alerts
Telescope fires an alert when a rule trips and fans it out to one or more channels — Slack (formatted), a raw webhook, or your own custom sink. Rules are evaluated on an unref'd interval (every, default 1m); each rule has a per-rule cooldown (default 15m) to suppress re-notifies. A failing channel is logged once per channel and never crashes the host — one channel failing never blocks the others. A configured alerts with no destination (neither channels nor the legacy webhookUrl) or empty rules is a fail-closed boot error.
import { slackChannel, webhookChannel, customChannel } from '@dudousxd/nestjs-telescope';

TelescopeModule.forRoot({
  alerts: {
    // The external URL of your dashboard — used to build deep links in alerts.
    dashboardUrl: 'https://telescope.example.com/telescope/',
    channels: [
      slackChannel(process.env.SLACK_WEBHOOK_URL),
      webhookChannel(process.env.OPS_WEBHOOK_URL),
      customChannel(async (alert) => {
        await sns.publish({ TopicArn, Message: JSON.stringify(alert) });
      }),
    ],
    every: '1m',
    cooldown: '15m',
    rules: [
      { type: 'new-exception', window: '1h' },
      { type: 'exception-rate', window: '5m', threshold: 10 },
      { type: 'slow-request-rate', window: '5m', thresholdMs: 1000, count: 20 },
      { type: 'dropped-entries', threshold: 100 },
    ],
  },
});
Rules
new-exception— fires the first time an exception's error family (familyHash) is seen withinwindow, i.e. a genuinely new error. Evaluated per flush (not on the interval) so a new error pages you within a flush interval, and the alert carries rich context (see below). Dedup uses a bounded in-memory map — see the multi-replica note. By default this rule only ever sees real server errors: expected 4xx control flow (a 403ForbiddenException, a 404, a validation 400) is not recorded as an exception entry, so it can never open a family or page you. See Exception capture. Setexceptions.captureHttp4xx: trueto opt 4xx back in.exception-rate—>= thresholdexceptions inwindow.slow-request-rate—>= countrequests slower thanthresholdMsinwindow.dropped-entries— RecorderdroppedCountgrew by>= thresholdsince the last evaluation.
Channels
slackChannel(url, options?)— POSTs Slack Block Kit JSON: a header with a severity emoji + rule name, fielded context (route, method, status, user, count/rate, window), a truncated stack snippet in a code block, and — whendashboardUrlis set — an Open in Telescope button deep-linking to the entry (${dashboardUrl}#/entries/exception/${id}).optionsaccepts{ username, iconEmoji }.webhookChannel(url)— POSTs the rawAlertPayloadJSON. This is the v1 behavior unchanged; existing relays that parse the raw body keep working.customChannel(fn, name?)— calls your asyncfn(alert)for anything else (email, SNS, PagerDuty, a DB row). Throwing is safe — the alerter isolates and logs it.
Slack recipe
- Create a Slack incoming webhook for the channel you want alerts in and copy its URL.
- Set it as an env var (e.g.
SLACK_WEBHOOK_URL) and pass it toslackChannel(process.env.SLACK_WEBHOOK_URL). - Set
alerts.dashboardUrlto your dashboard's external origin so the message includes an Open in Telescope button.
new-exception payload
When a new-exception rule fires, the payload adds an exception block pulled from the exception entry and its sibling request entry in the same batch:
{
  "rule": { "type": "new-exception", "window": "1h" },
  "value": 1, "threshold": 1,
  "firedAt": "2026-06-05T00:00:00.000Z", "instanceId": "host-1",
  "dashboardUrl": "https://telescope.example.com/telescope/",
  "exception": {
    "familyHash": "ab12…", "class": "TypeError", "message": "cannot read x",
    "stack": "TypeError: cannot read x\n  at …",
    "route": "/checkout", "method": "POST", "statusCode": 500, "durationMs": 1234,
    "user": "42", "occurrences": 1, "entryId": "0190…", "batchId": "0190…"
  }
}
The legacy raw-webhook JSON is backward compatible: every v1 field (rule, value, threshold, firedAt, instanceId) is unchanged; exception/dashboardUrl are purely additive.
Multi-replica caveat. new-exception dedup is an in-memory, per-pod map (capped at ~10k families, oldest evicted). In a multi-replica deployment the same new error family may alert once per pod the first time each pod sees it. This is acceptable for v1; a cross-pod store would defeat the goal of a cheap map lookup on the hot flush path.
Legacy webhookUrl
The v1 single webhookUrl is still accepted and is internally folded into a webhookChannel(webhookUrl), appended after any explicit channels. Prefer channels for new configs. meta.alerts reports { enabled, ruleCount }.
Traces
When you run the OpenTelemetry provider, each entry is stamped with the ambient traceId / spanId. The dashboard then offers a #/traces/:traceId route that lists every entry sharing that trace — the in-app correlation view — alongside a deep-link out to your trace backend (Jaeger / Grafana / …) via the configured traceLink template. The Traces nav item only appears once a traceContext provider is configured; without one there are no trace ids to correlate, so the link is hidden (the route still resolves on a direct visit).
Queues console (Horizon-style)
When you register a queue manager, the dashboard gains a live queue console:
- Queue list with live per-state counts (waiting / active / delayed / failed / completed / paused) and a paused flag, across every driver (BullMQ, SQS).
- State tabs → job table with redacted payload previews.
- Job detail drawer —
data,opts, attempts, stacktrace, return value (all passed through core redaction first).
Mutations & authorizeAction (default-deny)
The console can also act on jobs — retry, remove, promote, retry-all (BullMQ), and redrive (SQS DLQ). These are denied by default. They run behind a second guard on top of the read authorizer, and that guard fails closed: without an authorizeAction callback, every mutation endpoint returns 403 — even for callers the read gate already trusts. The action buttons appear only when allowed; queues advertise an actions capability hint so, for example, the Redrive button shows only for SQS queues that actually have a DLQ.
TelescopeModule.forRoot({
  authorizer: (ctx) => isAdmin(ctx.request),       // reads — browse queues/jobs
  authorizeAction: (ctx, action) => canMutate(ctx.request), // mutations — separate, default-deny
  queueManagers: [/* BullMqQueueManager / SqsQueueManager */],
});
Keep authorizeAction strictly narrower than your read gate: browsing a queue should not imply the right to drain it. See the queue manager packages for the full endpoint and action tables.
Schedules
@nestjs/schedule runs surface as their own view: each @Cron / @Interval / @Timeout tick opens a schedule batch and records a job entry (outcome + duration), so you can see which scheduled tasks ran, how long they took, what they emitted, and which failed. See the schedule watcher.
Build your own
The same pieces are exported so you can drop them into your own admin instead of using the turnkey app:
import { TelescopeProvider, useEntries, EntriesTable } from '@dudousxd/nestjs-telescope-ui/react';

function MyEntries() {
  const { data } = useEntries({ type: 'query' });
  return <EntriesTable entries={data?.data ?? []} />;
}
// wrap your tree once in <TelescopeProvider> (defaults to the /telescope/api base)
import { createTelescopeClient } from '@dudousxd/nestjs-telescope-ui/client';
const telescope = createTelescopeClient({ baseUrl: '/telescope/api' });
const page = await telescope.entries({ type: 'job' });See the -ui package for the full exports map and peer dependencies.
Gating the dashboard
The UI shell and hashed assets are public (they contain no data); the API behind them is what's gated. For a production-grade login that works even when your app uses header-Bearer auth, see Dashboard auth.
Extensions
A declarative SPI for packaging watchers, a navigable entry type, dashboard pages, and server-side data providers into one installable unit — the fixed UI renders the spec, the extension ships no React.
Dashboard auth
Gate the Telescope dashboard so only your logged-in admins see it — all the way to prod, no infra required. Two modes, one signed-cookie mechanism, both copy-pasteable.